Experiment View
The Experiment View presents the full record of a single run across a series of tabs. It is reached by selecting an experiment from the experiments list.
The same set of tabs is exposed for every experiment, regardless of type. Their usefulness depends on the workload: the Metrics tab is most relevant for Classical ML runs that log training-curve values, while the Traces and Evals tabs are most relevant for Generative AI runs that operate over LLM calls and evaluation datasets.
Overview
The Overview tab consolidates the run's structured summary.
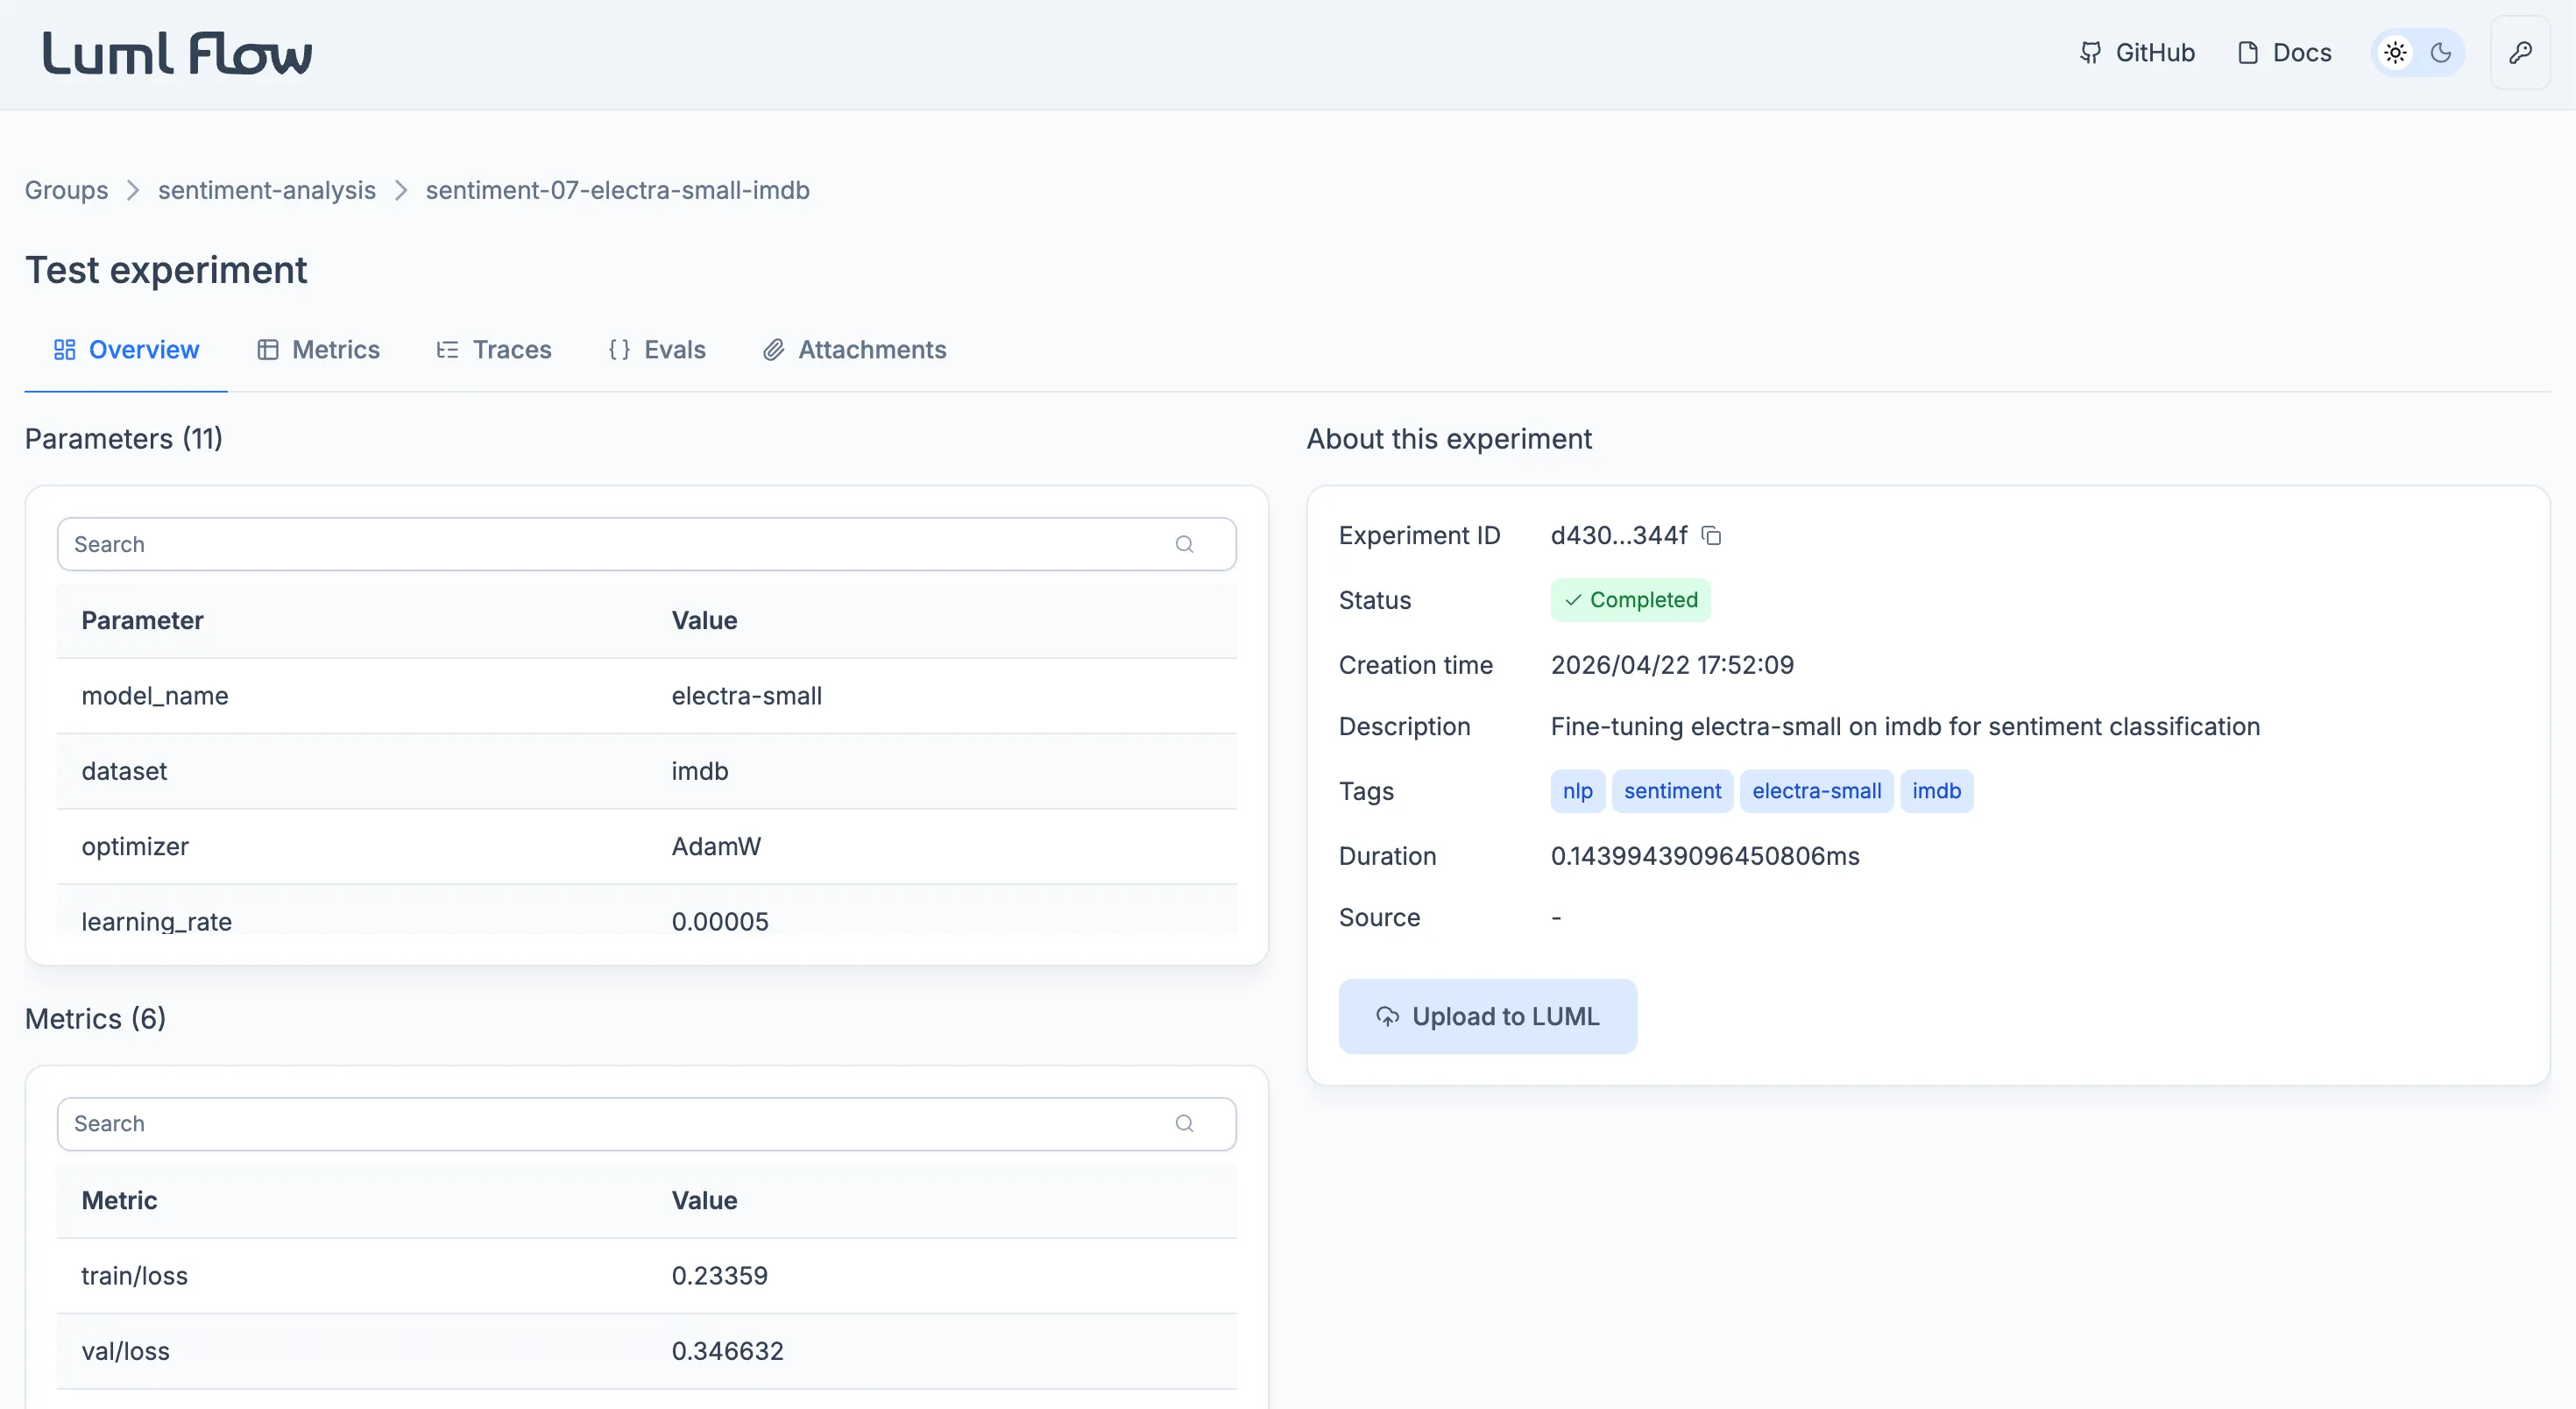
Three tables list the run's recorded values. Parameters holds the static values defined before the run, such as hyperparameters and configuration settings. Metrics holds the dynamic values recorded during the run, captured at one or more steps. Logged Models lists models that were trained during the experiment and registered against it; the table is empty when no model was logged.
An information card alongside the tables consolidates the run's identifying metadata: the experiment ID, current status, creation time, user-supplied description and tags, total duration, and the source .py file. The card also exposes the Upload to LUML action, which promotes the experiment to the Registry. See Uploading to LUML.
Metrics
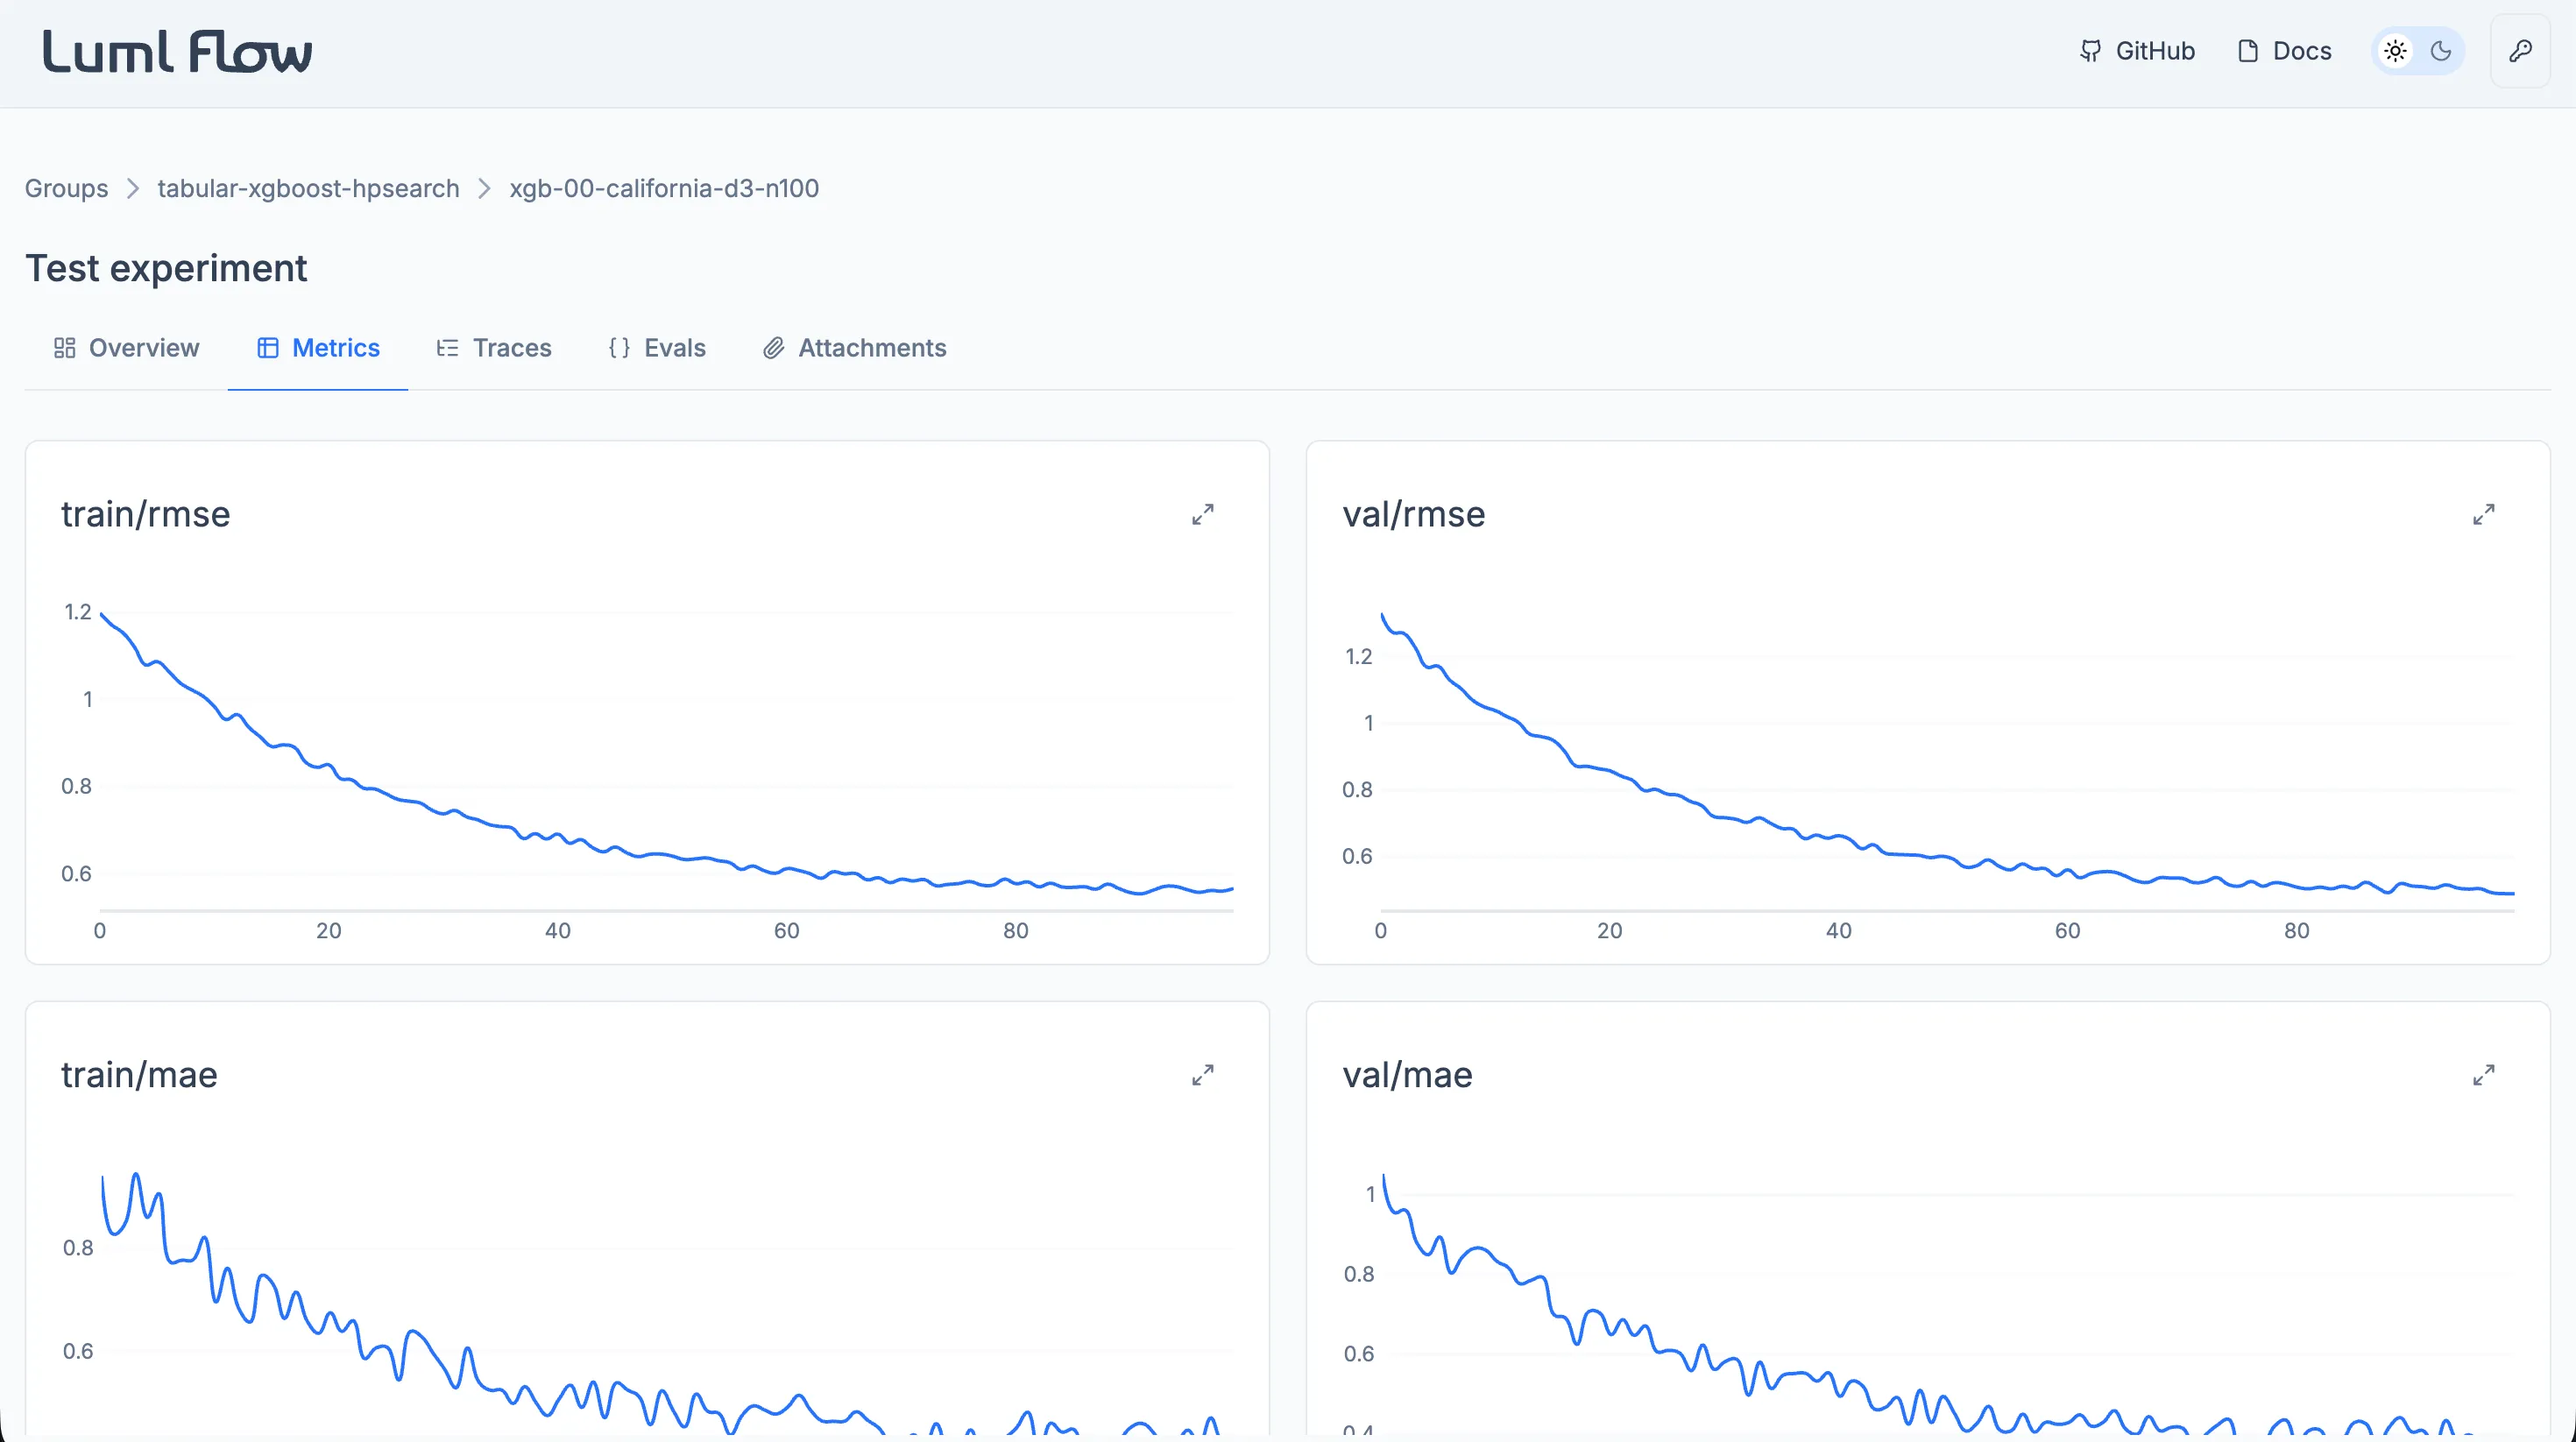
The Metrics tab renders each logged metric as an individual interactive plot. Plots support inspection of values at specific steps and zooming into ranges of interest, which makes it practical to follow how a metric evolved over the course of training.
This tab is primarily intended for Classical ML runs, where metrics such as loss or accuracy are recorded at successive training steps. Generative AI runs typically rely on the Evals tab instead, but any dynamic value logged through the SDK will still appear here.
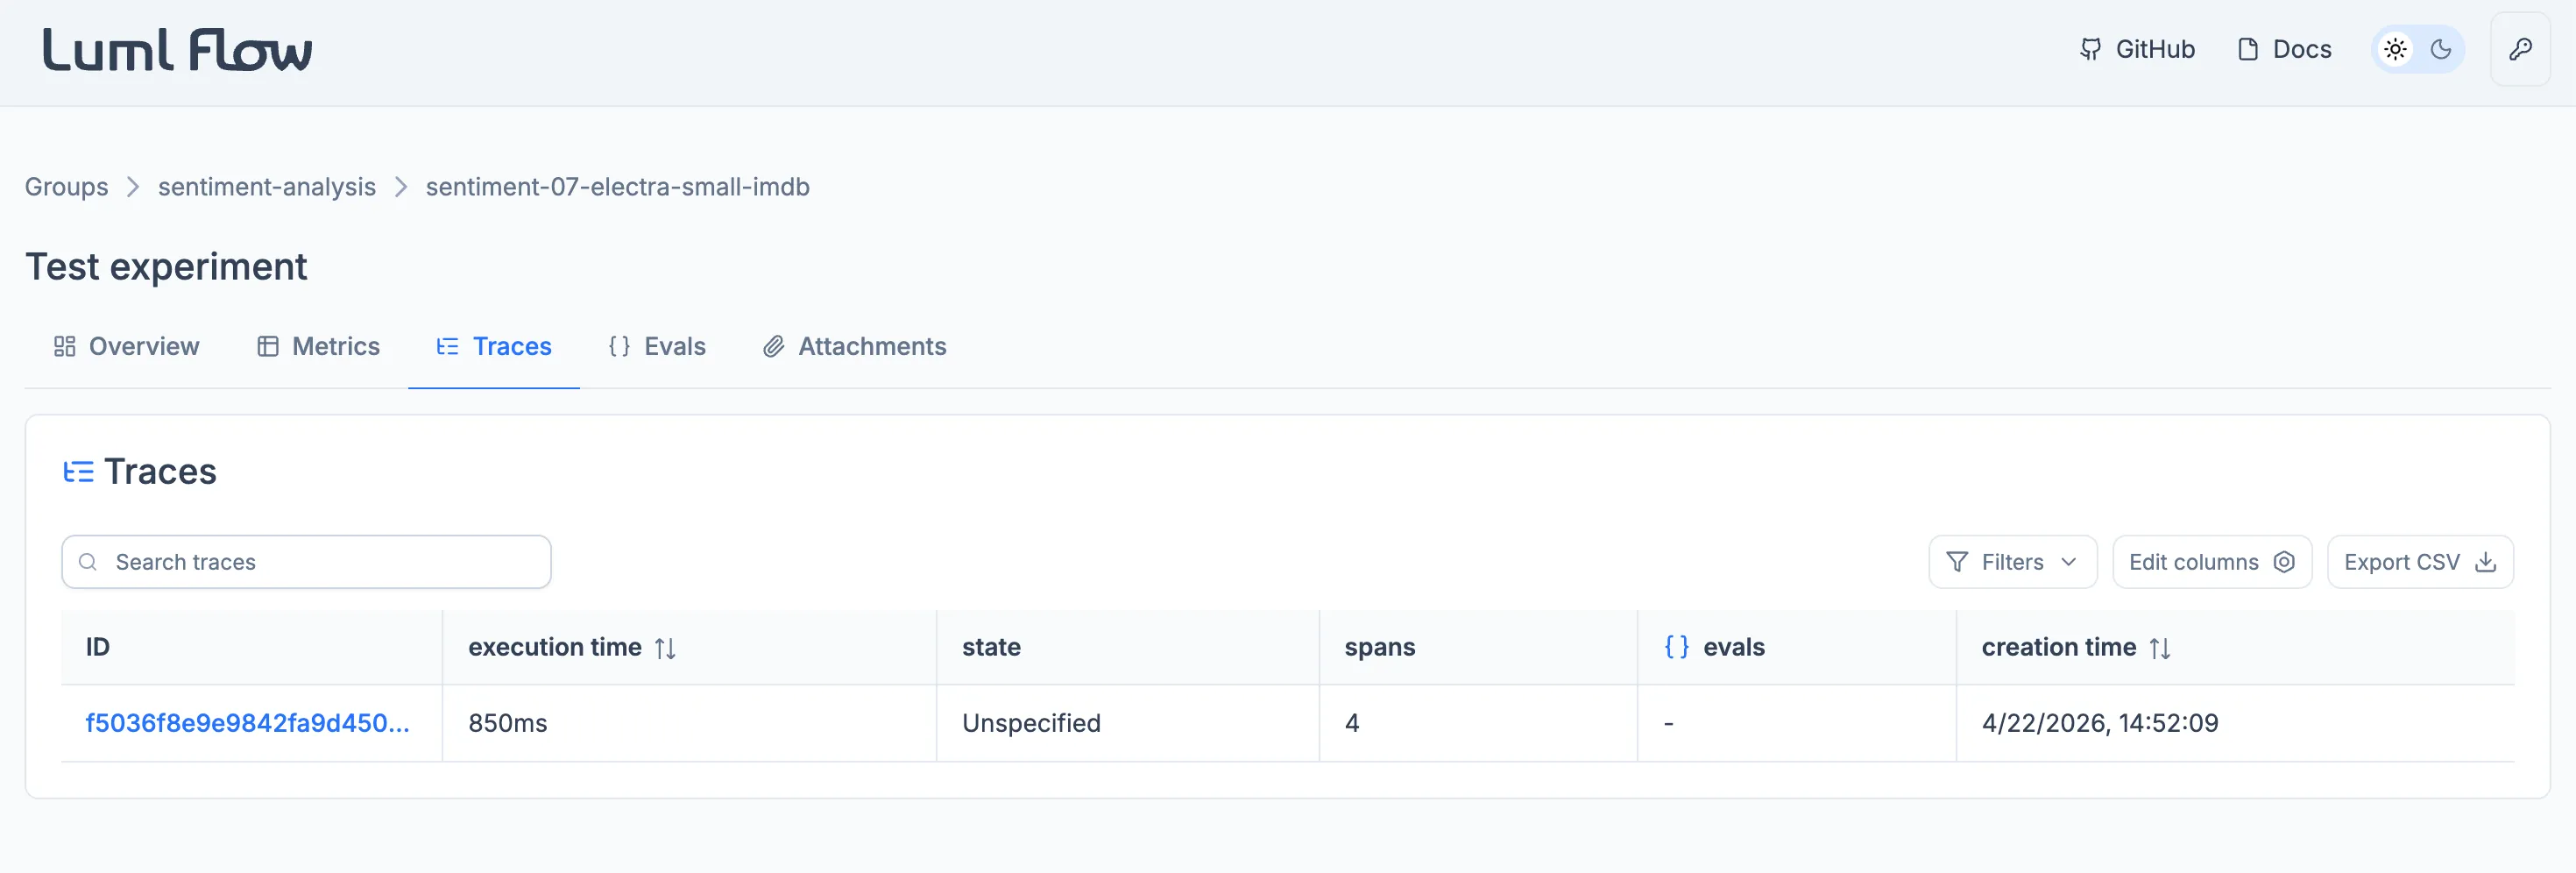
Traces
The Traces tab captures the execution flow of the run. Each operation within the system, including model calls, tool invocations, and intermediate steps, is recorded as a span, and related spans are grouped into a trace. This view makes it possible to inspect how prompts, model parameters, and tool calls combine to produce a given output, and to locate bottlenecks or unexpected behavior in the workflow.
Traces are most informative for Generative AI runs, where the execution path through an LLM-based system is the primary object of analysis. They remain available for Classical ML runs but are rarely populated for that category.
Individual spans within a trace can be annotated. An annotation is a structured record attached to a span and comes in two types. A feedback annotation captures an assessment of the span's behavior and carries a name, the author's user name, a boolean value, and an optional rationale. An expectation annotation declares the expected outcome of the span and carries the same fields, except that the value can be a string, integer, or boolean.
Annotations can be added through the Flow interface or written locally through the LUML SDK. They can be added, edited, and removed inside Flow. Once the experiment is uploaded to LUML, the annotations are carried with the run and remain visible in the Registry, where they become read-only.
Note: traces are captured using OpenTelemetry, an open standard for distributed tracing. Any instrumentation compatible with OpenTelemetry can be ingested by Flow.
Evals
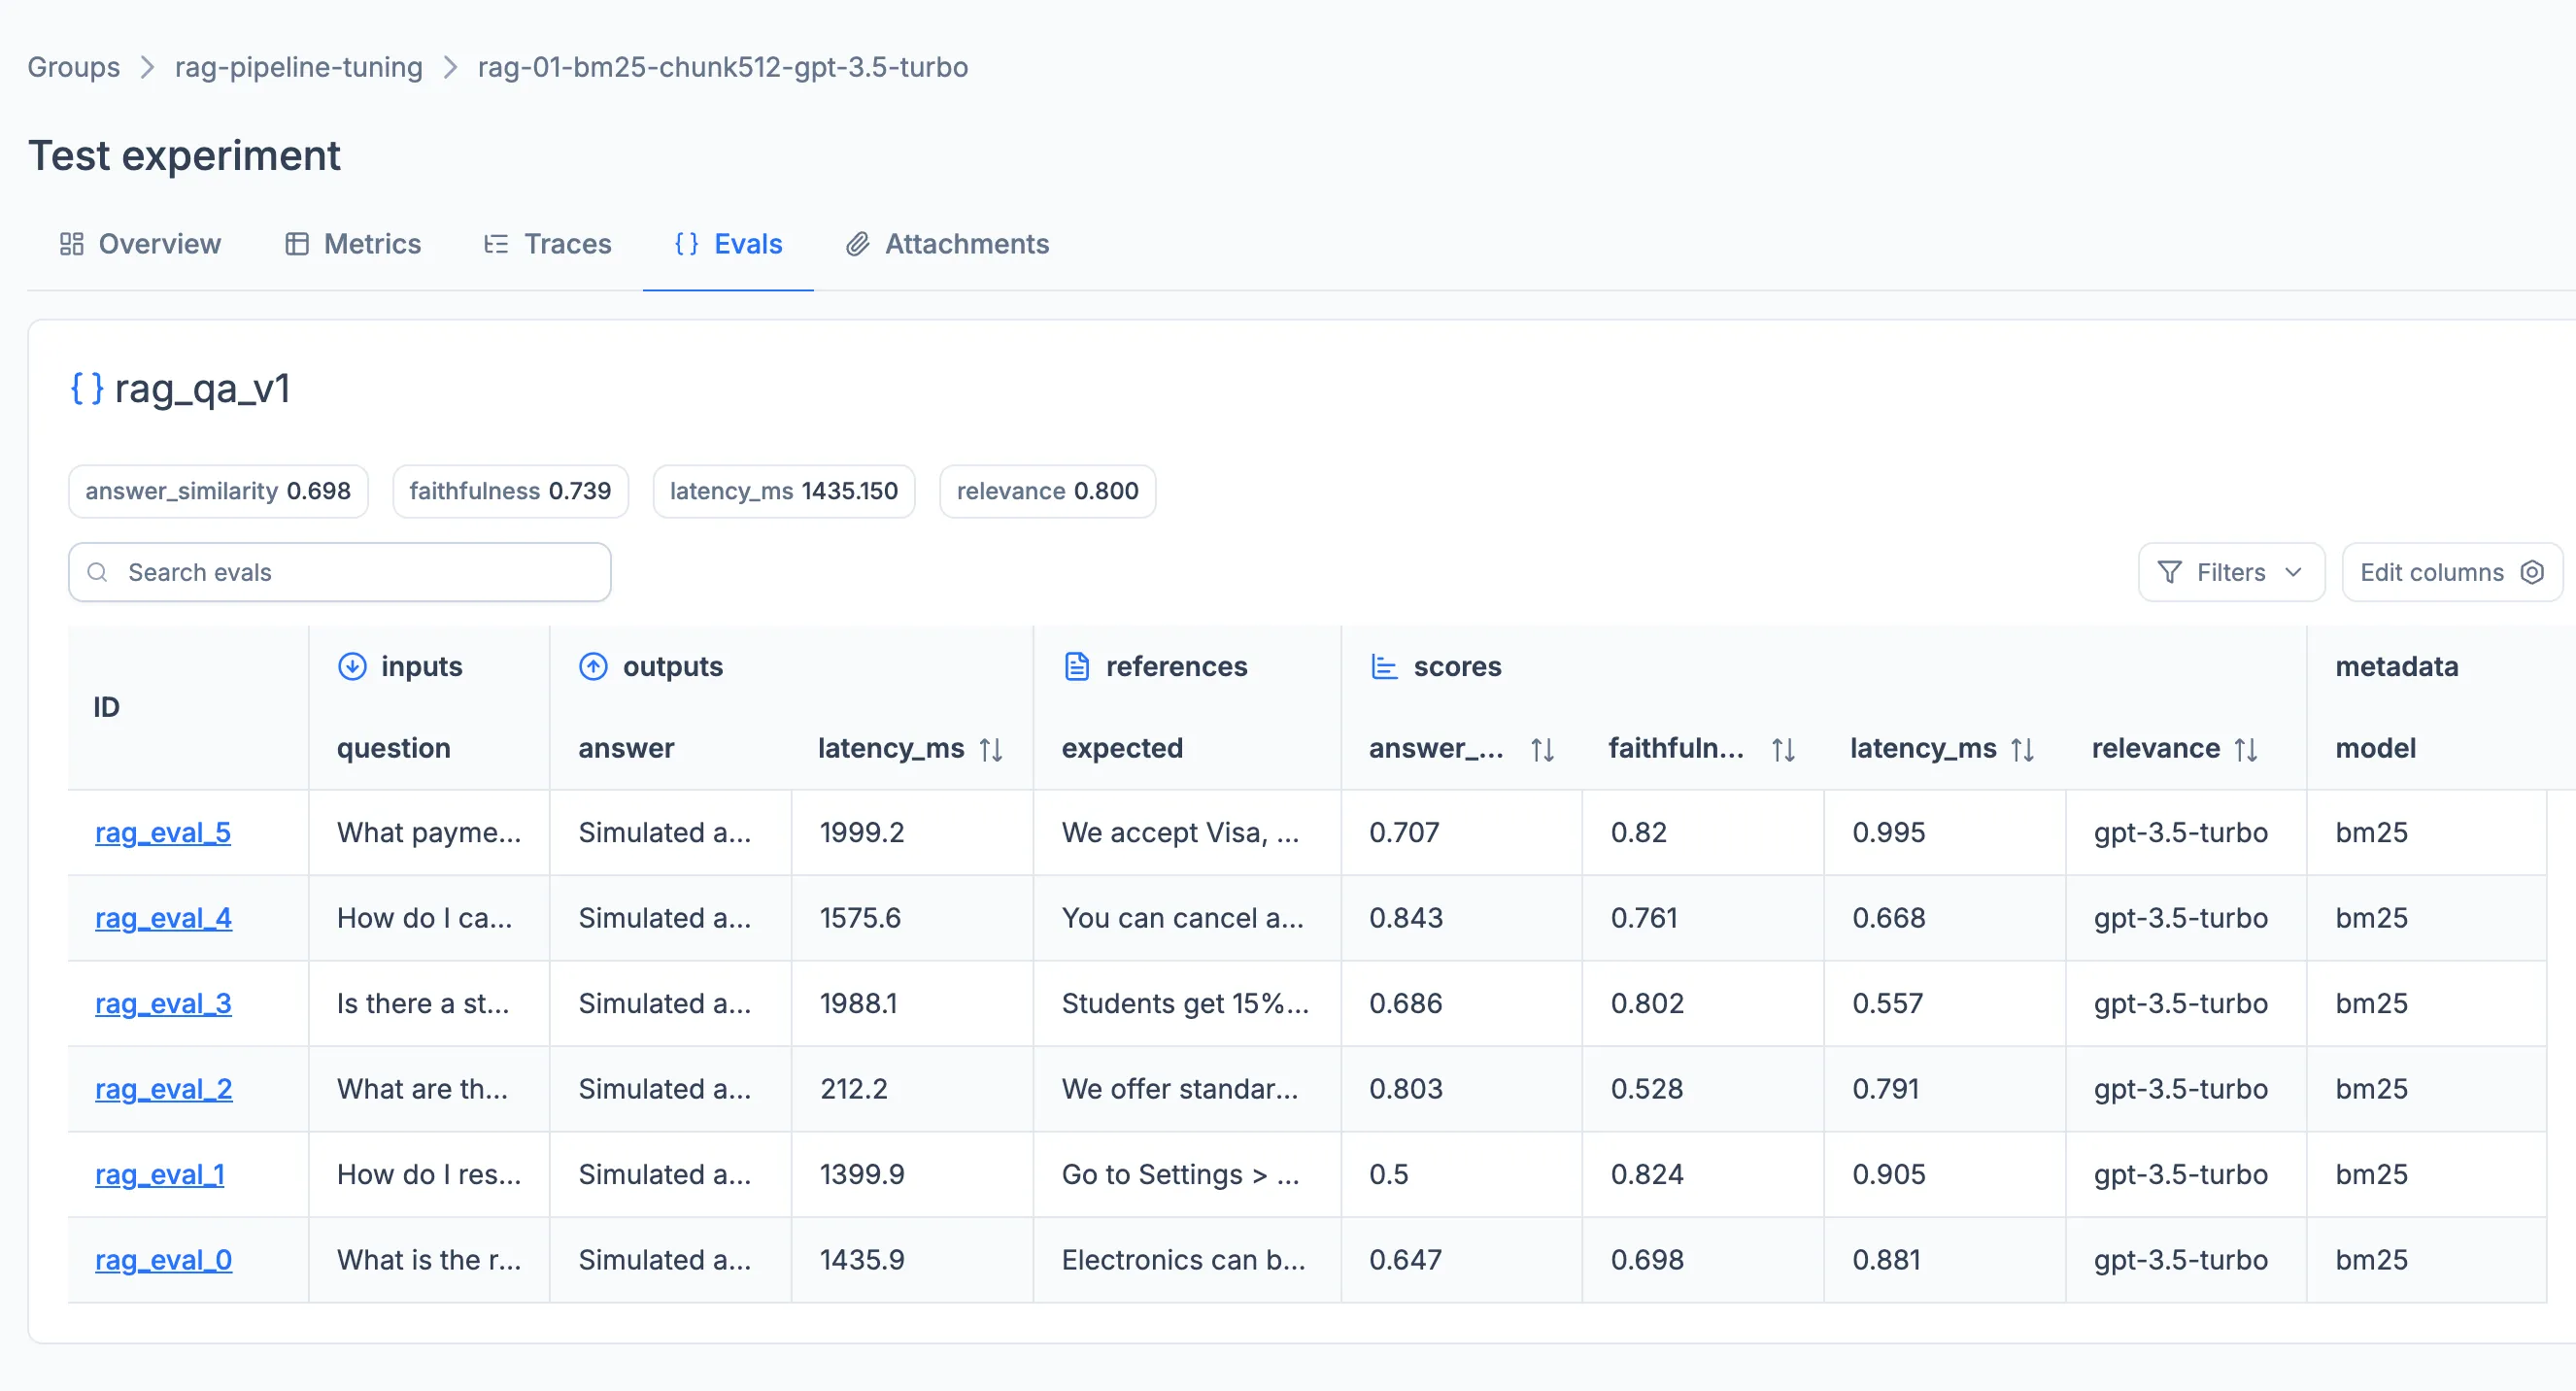
The Evals tab provides a structured way to assess the quality of a model or agent against a fixed set of inputs. Each evaluation is driven by an eval_set in which every sample represents a question or prompt for the model. Scoring can be configured by supplying a user-defined scoring system directly, or by building scorers with the LUML SDK and applying them to the run. Aggregated scores and per-sample results are surfaced inside the tab.
Evals are aimed at Generative AI runs, where output quality cannot be judged by a single training metric. They are not typically used for Classical ML, which relies on the Metrics tab.
Per-sample evaluation results can be annotated in the same way as trace spans, using the same feedback and expectation types. Annotations can be added through the Flow interface or written locally through the LUML SDK, and persist with the experiment. After the run is uploaded to LUML, the annotations remain visible alongside the eval results in the Registry, where they become read-only.
Attachments
The Attachments tab exposes files of any format that were logged to the experiment by the user. Common formats — .docs, .pdf, .png, .csv, .img, and .svg — are previewed inline. Other formats remain attached to the experiment and can be downloaded for local inspection.